

See the system in operation: live EnviroHub operator console. Project context and additional material: EnviroHub project page.
All right, the mic is mine. And here is the spoiler: we could have connected a few sensors to an ESP32, sent numbers to a server once a minute and proudly called it IoT. It would have worked right up to the first Wi-Fi outage, stalled process and awkward question: “Guys, where did the data go?”
That is why we built EnviroHub as a small telemetry platform, not another attractive thermometer. It currently monitors air in an apartment, but the same data path can be adapted to an office, warehouse, greenhouse, workshop, engineering equipment or a network of remote sites. Sensors and application logic change; the delivery, storage and diagnostic principles remain.
An important qualification: “industrial” here refers to the discipline applied to data and failure handling, not to the enclosure. EnviroHub is not presented as an industrial-grade or certified instrument, nor as a safety gas detector.
Why make it this complicated?
A simple “ESP → cloud API” design has an unpleasant habit: no internet means no history; when the server is unavailable, nobody knows what was already delivered; and the device on the local network must either be exposed to the outside world or surrounded by workarounds.
We wanted answers to the dull but important questions: where is the data stored, who confirmed the write, what happens after a restart, and how do we identify the exact segment that failed? No Kubernetes theatre on a Raspberry Pi—the complexity has to solve a specific problem, not decorate an architecture diagram.
The operating chain looks like this:
Sensors → ESP32-S3 → MQTT 5/TLS → EnviroHub Edge Gateway
        → outbound HTTPS Public Bridge → website → smart home → Alice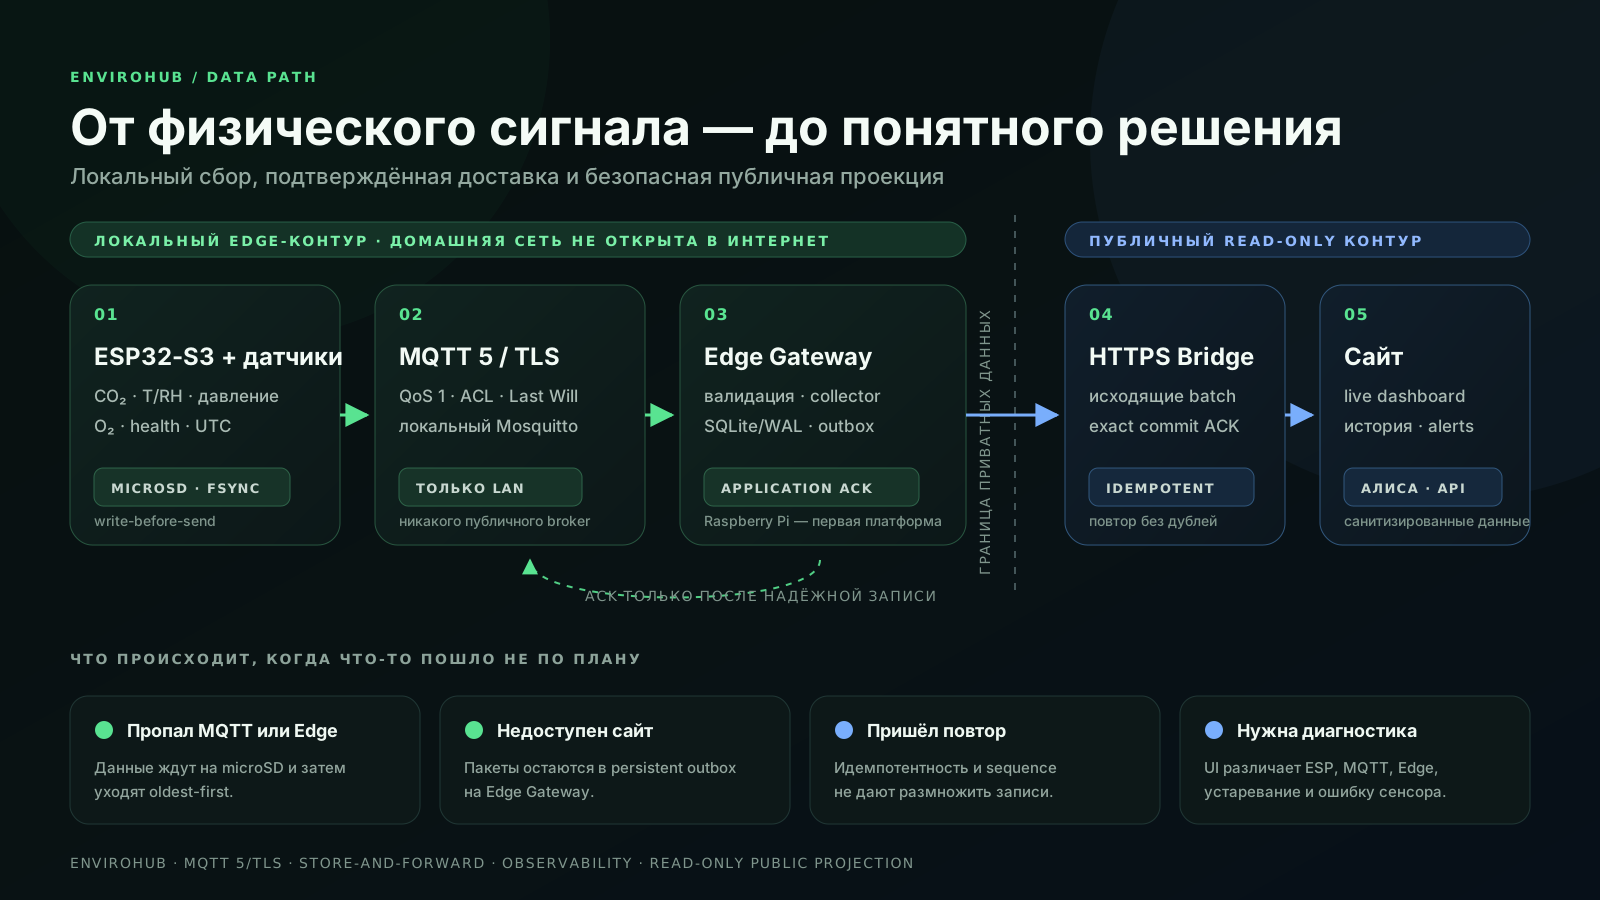
The Raspberry Pi is the hardware platform for the first EnviroHub Edge Gateway, not a “little box for the website”. Mosquitto, the collector, SQLite storage and durable synchronization queues run there in isolation. MQTT stays inside the LAN. There are no inbound ports into the home, no requirement for a static public IP and no router port forwarding: the gateway sends only a sanitized public projection.
Seven physical channels—no invented numbers
The measurement node is built around an ESP32-S3. It reads CO₂ from an SCD41; indoor and outdoor temperature and humidity from two SHT45 sensors; pressure from a BMP390 and backup BMP58x; and oxygen from a separate analog path using an Alphasense O2-A2, OPA333 and ADS1220. In the public interface, that becomes seven clear channels. Service diagnostics live separately and never masquerade as physical measurements.
The current build really was assembled quickly on loose wires. That was deliberate: first validate the complete data path, failure response and interface; then move on to a custom board, mechanical design and protected placement for the outdoor sensor.

One data packet and five layers of reassurance
-
The ESP writes the packet to microSD first. Exact NDJSON is used for automated replay;
readable CSV is available for manual inspection. First
append + fsync, then transmission: write-before-send. - The packet travels over MQTT 5 with TLS. The device has separate credentials, its permissions are restricted by ACL, and a Last Will reports an abrupt session loss.
- The Edge Gateway validates and stores the data. Format, time, quality and sequence are checked before a single atomic SQLite/WAL transaction.
- An application ACK is sent only after the commit. MQTT PUBACK confirms broker delivery, but does not prove that the application record will survive a collector restart.
- After the ACK, the device advances its durable cursor. During a normal connection loss, the queue remains on the card and later replays from oldest to newest. Stable record identifiers and idempotent handling prevent duplicate records on redelivery.
The same logic continues beyond the Edge Gateway. Packets wait in a durable outbox, the website returns an exact acknowledgement of the HTTPS packet commit, and only then is the record removed from the queue. A redirect is not accepted as success, timeouts are bounded, and retries use a stable idempotency key.
| Layer | What is stored | Purpose |
|---|---|---|
| ESP32-S3 microSD | NDJSON queue and daily CSV | Store-and-forward during MQTT or Edge Gateway outages |
| Edge Gateway | Detailed operating history in SQLite/WAL | Local processing, diagnostics, settings and outbound queue |
| Website | A separate, permitted public projection | Long-term charts without access to the local network or private data |
This is more than a diagram. During a controlled broker outage, the ESP accumulated three records and delivered them in order after the connection returned. A separate reset confirmed that an unacknowledged record survives a device restart.
An interface that does not lie
The main screen deliberately looks less like a landing page with one enormous number and more like a compact operator console. It shows current values, data freshness, microSD and Edge database usage, the latest availability event and the first problematic segment in the chain: ESP, MQTT or Edge/connectivity.
“Sensor returned an error”, “data is stale” and “station went offline” are three different conditions. If one sad dash represents all of them, the operator gets a puzzle instead of an interface. Current cards therefore come from fresh live state, while archive charts use a separate time series.
A compact 24-hour history and summary are available for a quick glance. For investigation, detailed charts cover periods from one hour to 30 days: up to three measurements can be compared at once with independent scales and exact values on hover or touch. A lightweight live snapshot loads first; the heavier history follows in the background.

Settings are not fired at the device in blind faith either. The website creates a desired revision, the Edge Gateway delivers it over MQTT, the ESP stores the configuration and returns the state it actually applied. Until that response arrives, the interface clearly distinguishes “desired” from “now operating”.
Visitors may view the console, while changes are protected by a server-side PIN with attempt limits and separate machine tokens. Alerts reach the owner through a durable Telegram queue only when state changes— no machine-gun burst of notifications for every brief network hiccup.
And yes, we brought the data all the way to Alice
We connected the same public data model to Yandex Smart Home. Through Yandex Station, Alice can report the current temperature, humidity and atmospheric pressure. This required neither a second MQTT broker, another telemetry collector nor inbound access to the Edge Gateway.
A read-only adapter on the website reads the already sanitized projection. Authorization associates the device only with the permitted owner, control commands are unsupported, and local identifiers and the full history never reach the smart-home service. CO₂ and O₂ are not currently published to Alice: the voice interface receives exactly the three channels that passed separate verification.

Now for the honest part: there were bugs
The most instructive one appeared after we expanded diagnostics for the oxygen channel. The ESP LED kept flashing a cheerful blue and Wi-Fi was alive, while the MQTT broker had already announced the station offline through its Last Will. A classic engineering meme: the light says “everything is fine”; the system replies, “mate, it really is not”.
Serial and broker logs pinpointed the root cause: a deadlock between the publishing task and the MQTT callback. We removed the lock inversion completely—the callback publications moved to a non-blocking queue, the conflicting mutex was removed, the MQTT buffer was enlarged and the status-packet size was capped. An independent supervisor was added as a second line of defence, not as a workaround instead of a fix. After reflashing, the station passed HIL verification without another disconnect: the MQTT session remained stable, archived packets received application ACKs, the microSD queue drained, and the website showed online status and all seven physical channels. This specific failure was closed and verified end-to-end.
But the honest part does not end there. A public audit found a 14-hour 15-minute gap in the history. A read-only microSD check confirmed that no source CSV or NDJSON records exist between the neighbouring entries in that interval, so there was simply nothing to recover. We did not fill the hole with invented values; instead, both compact and detailed charts now show it as a real break in the line. Claiming that data is “never lost at all” would therefore be wrong.
The incident produced a specific improvement: connectivity is no longer treated as proof of collection and storage. The system separately reports the latest physical sample, the latest durable append to microSD and the latest application ACK. This has now been verified beyond a short test: during 48 minutes of MQTT and Edge unavailability, the powered ESP continued to accumulate a queue. After recovery, 20 records reached the Edge and website oldest-first, with their original UTC timestamps and no duplicates. Both queues were empty at the end.
This is what observability means to us: not a green “all good” light, but the ability to separate sampling, local recording, transport, server commit and public synchronization—and see exactly where acknowledgements stopped.
What carries over into a client project
EnviroHub is not hard-wired to climate sensors. The same architectural foundation can support monitoring for equipment, rooms, warehouses, greenhouses, energy systems or distributed engineering nodes. A new project changes the signal sources, processing rules, user roles and presentation; the base mechanisms are designed for the specific requirements, but do not start from a blank sheet.
- Stability: write-before-send, durable queues, application acknowledgements and service supervision.
- Scaling: versioned contracts, separate node credentials and ACLs, idempotent delivery.
- Flexibility: sensors, thresholds, intervals, commands and public views remain separate.
- Observability: freshness, health, failure domains, backlog, availability events and change history.
- Safe boundary: the local broker is not exposed to the internet; only an approved projection leaves the site.
We deliberately avoid putting a magic Enterprise sticker on EnviroHub or pretending it is a certified gas detector. What we can show is exactly what has been implemented, which failures were tested, where the durable queues live and which areas still require verification. For an engineering system, that is more useful than a loud adjective.
See the system in operation: live EnviroHub operator console. Project context and additional material: EnviroHub project page.
If you need a system that does more than draw attractive cards—one that measures, stores, explains its state and recovers after trouble—it looks like we speak the same language.